Who suffers most?
In Somalia, families pay for health care out of pocket at the moment they can least afford it. New analysis shows that the resulting hardship is not random. It is concentrated, patterned, and therefore targetable.
✍️:
Dr Abdulrazaq Yusuf Ahmed
MPH, MSc(HM), PhD (Health Economics), PhD (Demography & Social Sciences)
Health Systems Expert | Public Sector Transformer | Academic Researcher
Director General, National Health Insurance Authority (NHIA)
Federal Ministry of Health, Somalia
Founder of RIYAADA Institute for Leadership and Governanve
Address: Via-Londra Street; Hamarjabjab District; Mogadishu; Somalia
ContactsEmail: drjalaal@nhia.gov.so; drjalaal@hotmail.com; drjalaalahmed@gmail.com; drjalaal@riyaadaacademy.com
Phone: +252 615 572 605; +252 616 258 604
Web: drjalaaludiin.com
Research: ORCID | Scopus: 57222062380 | WoS: ADD-3214-2022
Links: RUGSAN | RIYAADA | LinkedIn
 .
.
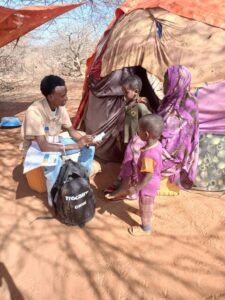
A child develops a fever that will not break. The family weighs the cost of travel against the risk of waiting. They go. They pay for the consultation, the medicines, the tests, and the ride home. To cover it, they sell a goat.
The child recovers. The household does not. The animal that was sold was not a luxury; it was a productive asset, part of the machinery that generates next year’s income. The illness lasted a week. Its economic shadow lasts years.
This is what health financing looks like when risk is barely pooled. In Somalia, out-of-pocket payments account for roughly 45% of current health expenditure, compared with a global average near 18.6%. Formal insurance reaches a small, mostly urban minority. For nearly everyone else, illness is paid for in cash, at the counter, on the day.
We know this at the level of the national accounts. What we have not known, with any precision, is who is being crushed by it. That is the question this analysis was built to answer.
| HEADLINE FINDING
One household in four is spending catastrophically on health care. |
| Health spending ≥ 10% of total household consumption 25.0%
██████████████████████████████████
Health spending ≥ 40% of capacity to pay 25.6% ██████████████████████████████████
Health spending ≥ 25% of total consumption (severe) 7.8% ██████████████████████████████████
Bars scaled to 40%. Estimates from a calibrated model of 1,350 Somali households across urban, rural, nomadic and displacement settings. |
THE INSTRUMENTS
Two rulers, one uncomfortable answer
There are two accepted ways to decide when a health bill has become a catastrophe, and they answer slightly different questions.
The budget-share ruler asks what proportion of everything a household spends goes to health. Cross 10% and you are in trouble; cross 25% and you are in serious trouble. It is blunt, transparent, and internationally comparable — which is why it dominates global monitoring.
The capacity-to-pay ruler asks a sharper question: once a family has fed itself, what is left, and how much of that does health consume? Food is not discretionary. For a household spending three-quarters of its income on staples, a bill that looks modest against total consumption can wipe out everything else — the school fees, the rent, the small buffer that separates coping from collapse. The conventional trigger is 40% of what remains after food.
Poor households often look less exposed on the first ruler and far more exposed on the second. In Somalia, the two rulers converge at the national level — 25.0% and 25.6% — and that convergence is itself the finding. Health payments are not merely large relative to household budgets. They are devastating relative to the narrow margin households actually control.
| The two measures agreeing is not reassurance. It means the burden is heavy by any definition you choose. |
GEOGRAPHY
Hardship has an address
The national average is the least useful number in this study. Once disaggregated, a clear gradient appears, running from the city outward to the settlements and grazing routes.
| RESIDENCE GRADIENT
Catastrophic spending doubles between the city and the camp. |
| Urban 18.5%
██████████████████████████████████ Capacity-to-pay measure 16.3% · mean burden 6.1% of consumption Rural agro-pastoralist 23.7% ██████████████████████████████████ Capacity-to-pay measure 23.1% · mean burden 8.9% Nomadic pastoralist 32.1% ██████████████████████████████████ Capacity-to-pay measure 35.8% · mean burden 11.2% Displacement settlement (IDP) 38.5% ██████████████████████████████████ Capacity-to-pay measure 45.9% · mean burden 11.8% Share of households crossing the 10% budget-share threshold; bars scaled to 50%. On the capacity-to-pay measure the gradient is steeper still: 16.3% urban to 45.9% in displacement settlements — nearly one household in two. |
Almost one in two displaced households crosses the capacity-to-pay threshold. And the obvious explanation — that displaced people are simply poorer — turns out to be only part of the story.
Even after accounting for wealth, household size, chronic illness, and other factors, displacement still raises the odds of catastrophe by 90%. Living on the move raises them by 66%. Displacement and mobility are not just proxies for poverty. They are structural disadvantages in their own right: distance from fixed facilities, transport and lodging costs that never appear on a fee schedule, missing documentation, insecure livelihoods, and no assets to fall back on.
The policy consequence is direct. A financial protection scheme that targets only by income will systematically miss the people it most needs to reach. Targeting has to be geographic and status-based as well as economic.
INCIDENCE
A tax that rises as income falls
Run the same analysis across wealth quintiles and out-of-pocket financing shows its true shape. It is a tax on being ill, and it is steeply regressive.
| REGRESSIVITY
The poorest fifth face triple the risk of the richest. |
| Q1 — poorest 35.6%
██████████████████████████████████ Health takes 11.9% of everything this group spends Q2 29.6% ██████████████████████████████████ 9.8% Q3 26.7% ██████████████████████████████████ 8.2% Q4 21.9% ██████████████████████████████████ 7.2% Q5 — richest 11.1% ██████████████████████████████████ 5.1% Catastrophic health expenditure at the 10% threshold, by wealth quintile; bars scaled to 40%. On the capacity-to-pay measure the spread is wider: 43.7% in Q1 against 8.9% in Q5. |
Wealthier households absorb a health bill through savings, salary, or family support. Poorer households absorb it by eating less, borrowing on harsh terms, selling income-generating assets, or not seeking care at all. The same financing mechanism, applied to everyone equally, produces radically unequal welfare consequences. That is the definition of a regressive system.
DETERMINANTS
What actually drives a household over the edge
Descriptive gradients tell you where hardship clusters. A regression tells you what is doing the work once everything else is accounted for. Here the picture sharpens considerably.
| ADJUSTED ODDS OF CATASTROPHIC SPENDING
Chronic illness quadruples the risk. Nothing else comes close. |
|||||||||||||||||||||||||||
■ dominant driver ■ raises risk ■ protective Reference categories: urban residence, poorest quintile, no chronic illness, no facility delivery, uninsured, male-headed. Insurance points strongly in the protective direction but the interval is wide — only 3.3% of households had any coverage at all. |
The chronic illness trap
A household with a chronically ill member has more than four times the odds of catastrophic spending. This is not surprising, but it is decisive. Acute illness is a shock; chronic illness is a subscription. Every month brings the same medicines, the same monitoring, the same transport, the same consultation — and in a system with no prepayment, every month brings the same bill.
That is the mechanism behind the medical poverty trap. Illness depletes resources; depletion restricts future access; restricted access worsens the illness. In a system like this, diabetes and hypertension are not just clinical conditions. They are slow-motion financial diagnoses.
The maternity penalty
Here is the finding that should trouble health ministries most. A facility-based birth in the previous year doubles a household’s odds of catastrophic expenditure.
Consider what that means. Global health policy has spent two decades persuading women to seek skilled birth attendance, and rightly so — it saves lives. Somalia has invested heavily in that message. Yet when a family follows the advice, the system can hand them a bill large enough to sink them.
| We ask women to deliver in facilities. Then we charge them for complying. That is not a financing detail; it is a contradiction at the centre of maternal health policy. |
Evidence from across low- and middle-income countries is consistent: removing user fees for maternal services raises utilisation and improves financial protection simultaneously. There are few cheaper wins available.
Who is holding the household together
Female-headed households carry 44% higher odds of catastrophe. Each additional household member adds 11%. These are not exotic risk factors — they describe an enormous share of the Somali population, and they compound. In displacement settlements, 55% of households are female-headed and 62% sit in the poorest quintile. The vulnerabilities stack.
CONSEQUENCES
What families do when the bill arrives
Catastrophic expenditure is a threshold crossed. Impoverishment is what happens on the other side.
| THE POVERTY LINE
Paying for care pushed 4.6% of households below the poverty line. |
| ●●●●●●●●●●●●●●●●●●●●●●●●●●●●●●●●●●●●●●●●●●●●●●●●●●●
51 households remain above the poverty line after paying for care. POVERTY LINE ●●●●● Nearly 5 households were above the line before illness and fell below it because they paid for health care. ●●●●●●●●●●●●●●●●●●●●●●●●●●●●●●●●●●●●●●●●●●●● 44 households were already below the line before any health payment was made. Each dot is one household in 100. Poverty headcount rises from 44.4% before out-of-pocket payments to 49.0% after them. Because so many households start below the line, this understates the true welfare loss — you cannot be impoverished twice, but you can certainly be pushed deeper. |
And these are only the households the poverty line can see. Ask how the bill was paid and a second, larger picture emerges: among households that spent catastrophically, roughly 60% financed care through distress — selling livestock or productive assets, borrowing from relatives, taking credit from merchants, accumulating debt.
Distress financing is not a coping strategy. It is a transfer of cost from the present to the future. Livestock sold today is income foregone for years. Debt taken at the clinic door is a claim on every harvest that follows. For a displaced household with nothing to sell, the adjustment happens in the only account left: food, school, delay, or simply not going.
| 45%
of health spending in Somalia comes straight from households |
3.3%
of households have any insurance or prepaid coverage |
60%
of catastrophe-hit households sold assets or borrowed |
4.6pp
rise in poverty caused by paying for health care |
| BEING STRAIGHT ABOUT THE NUMBERS
These estimates come from a reproducible simulation, not a fielded household survey. Somalia has no national health expenditure survey, so a synthetic dataset of 1,350 households was built and calibrated against the Somali Health and Demographic Survey 2020, the WHO Global Health Expenditure Database, and World Bank poverty proxies, then analysed using standard WHO and World Bank financial-protection methods. What that buys you is a transparent, auditable pipeline: fixed random seed, documented parameters, every figure regenerable, and ready to be re-run the moment real microdata exists. What it does not buy you is precision. Read these numbers as plausibility-bounded planning figures — the right order of magnitude and, more importantly, the right shape — not as population parameters. The direction of every gradient reported here is robust. The decimal points are not. The honest conclusion is a request: Somalia needs a proper household health expenditure survey. Until then, this is a defensible way to plan.
|
RESPONSE
From evidence to instrument
| Concentrated problems are easier to solve than diffuse ones. Because hardship in Somalia clusters by place, household type, and cause, a relatively small set of financing instruments can deliver disproportionate protection. Each aligns with institutions Somalia is already building: the National Social Health Insurance Authority, the Essential Package of Health Services, and Damal Caafimaad.
NO RISK POOLING · REGRESSIVE BURDEN A single national pool Operationalise NSHIA as one pooled fund. Fully subsidise premiums for displaced, nomadic and poorest households, and purchase EPHS services on their behalf rather than asking them to pay at the door. |
CHRONIC ILLNESS · 4× THE ODDS
Continuity-of-care exemptions Zero co-payment for essential chronic-disease medicines and monitoring inside the benefit package, with pre-authorised refill protocols so a recurring condition stops generating a recurring bill. |
| MATERNITY PENALTY · 2× THE ODDS
Demand-side maternal subsidy Free or voucher-covered antenatal, delivery and postnatal care, delivered over mobile-money rails so unbanked and mobile households can actually use it. |
DISPLACEMENT RAISES RISK BEYOND WEALTH
Targeting by place, not just income Auto-enrol households in displacement settlements and pastoralist areas. Finance mobile and outreach delivery, because a fixed facility is not a service for a mobile population. |
| OPAQUE PRIVATE PRICING
Strategic purchasing Contract accredited private providers at negotiated tariffs, publish standard prices, and tie reimbursement to quality and price transparency. Somalia’s delivery system is private; the purchasing has to be public. |
DISTRESS FINANCING · ASSET DEPLETION
A ceiling on what a family can lose An annual out-of-pocket cap per household within benefit design, plus a pooled fund for high-cost episodes, so that no single illness can consume a household’s productive base. |
Where to start
Protection is cheapest where risk is most concentrated. Three first moves carry the highest return per shilling:
| 01 | Full premium subsidy for the poorest and the displaced
Two groups, clearly identifiable, carrying the steepest risk in the entire distribution. |
| 02 | Chronic-disease exemptions
The single strongest driver in the model, and the one where a fixed benefit rule removes a recurring shock permanently. |
| 03 | Maternal vouchers
Resolves an outright contradiction in current policy, and pays back in maternal and newborn outcomes as well as financial protection. |
None of these steps require institutions Somalia lacks. They require using the institutions already on paper for a clear purpose: protecting households before illness becomes poverty.
CONCLUSION
The answer is a roadmap: out-of-pocket financing in Somalia functions as a tax on illness. It is paid by the sick rather than the healthy, ignores ability to pay, and arrives precisely when earning capacity collapses. This system pushes one quarter of households into catastrophic spending and drives an additional 4.6% below the poverty line.
But the burden is not random, and that is the most useful finding in this analysis. It falls hardest on displaced households, families on the move, households living with chronic illness, women running households alone, the poorest fifth, and women who gave birth in a facility after doing what the health system asked of them.
| Because the burden is concentrated, patterned, and targetable, reform can be equally focused. The question in the title is not rhetorical, and the answer is not merely descriptive. By identifying who suffers most, Somalia can begin to build a financing agenda around protection, not payment at the point of need.
ABOUT THE AUTHOR Dr Abdulrazaq Yusuf Ahmed is Director General of the National Social Health Insurance Authority under Somalia’s Federal Ministry of Health and Human Services, Associate Professor of Health Systems Management at Benadir University, and Founder and Chair of the RIYAADA Institute for Leadership & Governance in Mogadishu. His research focuses on universal health coverage, health financing and health system resilience in fragile settings. ORCID 0000-0002-6985-1087 · drjalaaludiin.com social media handling https://www.instagram.com/drjalaal https://x.com/drjalaal https://www.linkedin.com/in/drjalaal/ https://www.facebook.com/jalaaludiin.yuusuf |
Published by RIYAADA Institute for Leadership & Governance ·
ISNI 0000 0005 3005 9908 · Ringgold ID 847744
Journal ISSN 3136-1943 applies to RIYAADA’s serial scholarly publication,
not to this web blog post.
Share this Article
Help others discover this article by sharing it with your professional network.